The D.A.T.A. Project
The D.A.T.A. Project was a very interesting activity for me. First we brainstormed for a topic we wanted to study. Then we thought of questions that we wanted to put in a survey for the class to take. Nicole then taught us about Quantitative, Qualitative and Bivariate data. We had to make sure we had all of these types of data in our questions. Our class took each others survey's and when we got the results back, my results were surprising to me. We made graphs for the data and put pictures with them to make them look creative. We ended up with very interesting creative and useful info graphics For me the D.A.T.A. Project, was fun yet challenging, and I can't wait to be able to do it again.
My theme was NFL Teams. My questions were along the lines of, what's your favorite team to why do you like your team? There were lots of San Diego Charger fans mostly because the reason they liked the chargers was because they are in San Diego.
My theme was NFL Teams. My questions were along the lines of, what's your favorite team to why do you like your team? There were lots of San Diego Charger fans mostly because the reason they liked the chargers was because they are in San Diego.
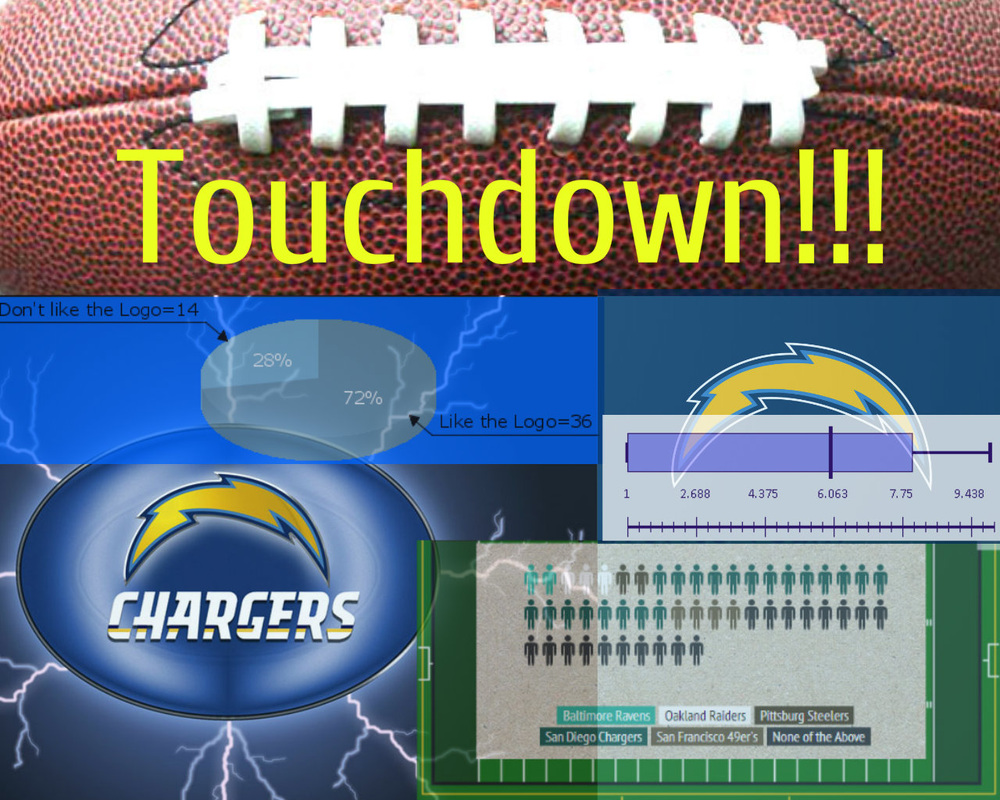
In conclusion, I discovered that the most popular team was in fact and did not at all take me by surprise was the San Diego Chargers. Like I said before because they are in San Diego. I also discovered that the majority of the two classes were not fond of their teams logo. Bivariate data helped me discover that boys liked their team better then girls. Qualitative and Quantitative data helped me realize that classmates didn't like their logo and did not like their team very much according to the 1-10 scale of liking.
